A Comparison of Land Surface Temperatures during the Day Averaged for December 2020

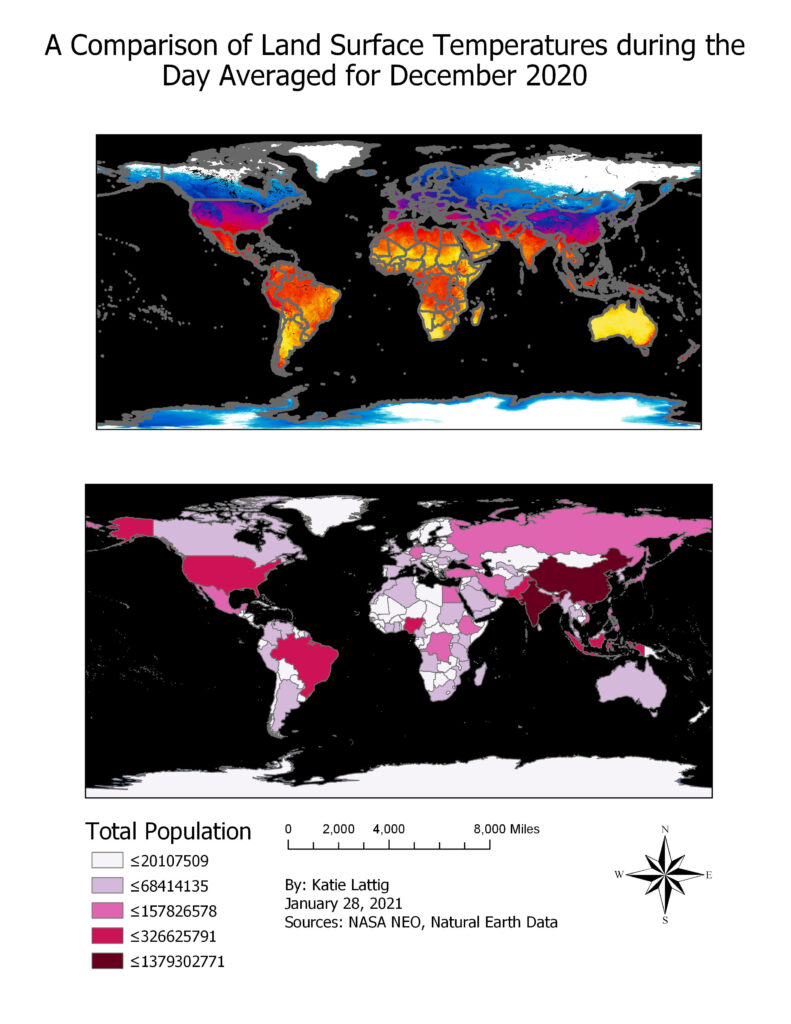
These two maps look at the average land surface temperatures for the month of December in 2020 and the total population. The top map represents the temperatures and the bottom map represents the total population with the legend, to read it, right below it.
[Assignment #2]